Results and Progress

We are very proud of the progress and achievements that our children make in their time with us. In 2023, our results speak for themselves!
Due to the small cohorts, percentages can be very misleading as each child carries a much higher proportion of the result than in a bigger school. Therefore one or two children achieving or just missing the standard can make a huge difference to an end result and year groups of children can vary considerably depending on how many children are included with additional needs.
Attainment – how did our children do at the end of Key Stage 2?
|
KS2 Results 2023 |
School |
County |
National |
|
Reading at the expected standard |
86% |
73% |
73% |
|
Reading at advanced standard |
43% |
29% |
29% |
|
Maths at the expected standard |
71% |
70% |
73% |
|
Maths at advanced standard |
14% |
20% |
24% |
|
Spelling, punctuation and grammar at the expected standard |
71% |
69% |
72% |
|
Spelling, punctuation and grammar at advanced standard |
43% |
26% |
30% |
|
Percentage of pupils achieving reading, writing and maths (combined) |
71% |
55% |
59% |
|
Percentage of pupils meeting the higher standard in reading, writing and maths (combined) |
0% |
5% |
8% |
|
Writing at the expected standard |
71% |
67% |
71% |
|
Writing at advanced standard |
0% |
9% |
13% |
|
Science at the expected standard |
71% |
- |
- |
|
Science at advanced standard |
0% |
- |
- |
key Stage 1 Results 2023
|
KS1 Results 2023 |
School |
County |
National |
|
Reading at the expected standard |
100% | 67% | 68% |
|
Reading at advanced standard |
20% | 14% | 19% |
|
Maths at the expected standard |
80% | 69% | 70% |
|
Maths at advanced standard |
0% | 11% | 16% |
|
Percentage of pupils achieving reading, writing and maths (combined) |
60% | 52% | 56% |
|
Percentage of pupils meeting the higher standard in reading, writing and maths (combined) |
0% | 3% | 6% |
|
Writing at the expected standard |
60% | 56% | 60% |
|
Writing at advanced standard |
0% | 5% | 8% |
|
Science at the expected standard |
80% | 78% | 79% |
| Reading, writing, maths and science | 60% | 51% | 56% |
Phonics Screening 2023
School = 100% Local Authority = 74% National = 75%
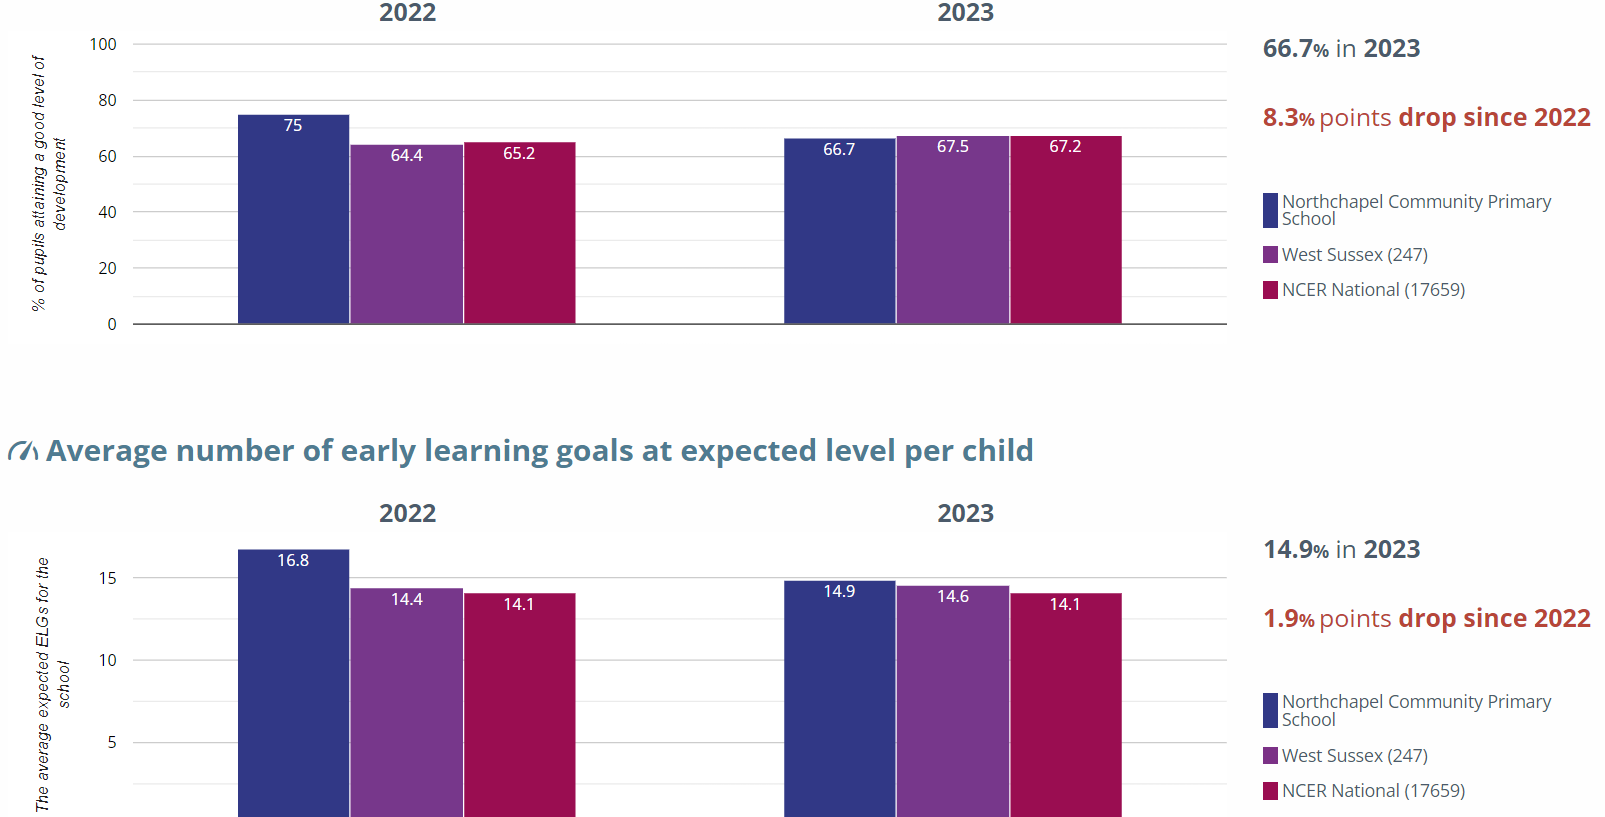
EYFS Good Level of Development 2023